|
INTRODUCTION: Perhaps you recall the analysis which was made of Census information in the Victorian period by members of the Blisworth Heritage Society. Here below is the equivalent analysis from the most recent census returns compiled by staff at the SNC (to provide background information for the current Local Plan). The format has been converted from regular pdf to 'internet page' in the interests of clarity, immediacy and brevity. |
|||||||||||||||||||||||||||||||||||||||||||||||||||||||||||||||||||||||||||||||||||||||||||||||||||||||||||||||||||||||||||||||||||||||||||||||||||||||||||||||||||||||||||||||||||||||||||||||||||||||||||||||||||||||||||||||||||||||||||||||||||||||||||||||||||||||||||||||||||||||||||||||||||||||||||||||||||||||||||||||||||||||||||||||||||||||||||||||||||||||
|
Parish Data: Blisworth The purpose of the data in this paper is to provide a picture of what your Parish is like now so that you can begin to use the information to consider what you would like your Parish to be like in 15/20 years. This profile is provided to offer a range of background information that might be useful during the rural settlement planning process that is being carried out to support the preparation of the South Northamptonshire Settlements and Development Management Local Plan. The information contained within this profile has been sourced and developed from the 2001 and 2011 censuses. Whilst not all of the information may be required for the purpose of this exercise, it was thought helpful to ensure that a comprehensive range of background information is available to Parish Councils. A map attached at Appendix B defines the boundary of the Parish to which the census data relates. Policy R1 of the Joint Core Strategy which will
provide the framework for the planning of rural areas and settlements
within this Local Plan aims to ensure that the scale of the future
development of rural settlements is consistent with the objective of
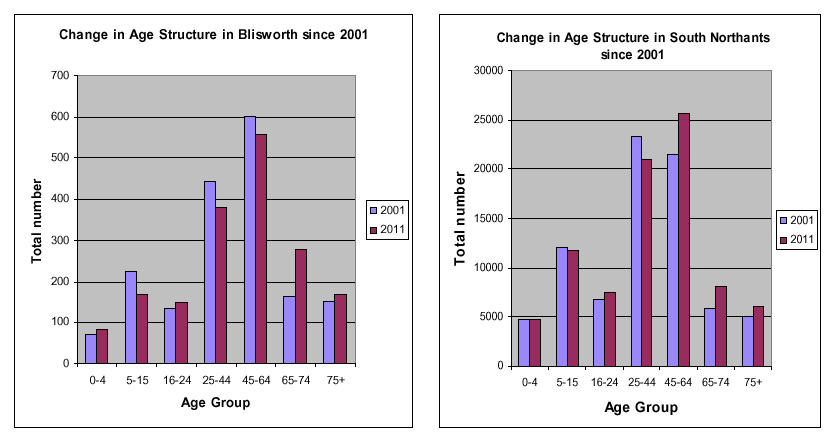
meeting local needs and 1. Population and Age Structurei There are a range of sources that can provide
information on the population of a Parish. The Census offers a
comprehensive source for population information. The table below
provides information on the population of the parish of Blisworth and
South Northamptonshire (SNC) as a whole.
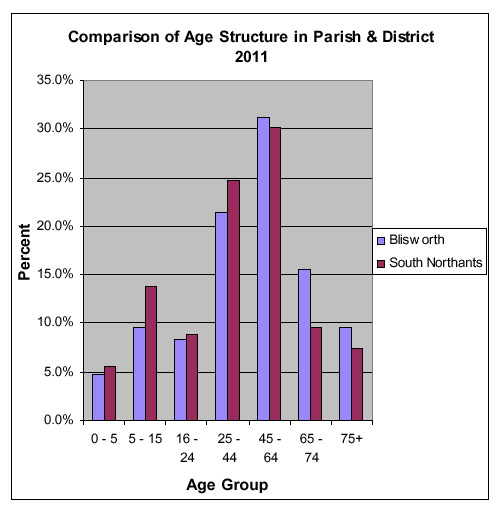
Population – Age Structureii Using
information from the 2001 and 2011 Censuses, a breakdown of the parish
population by
2. Housing Data Number of Householdsiii An estimate of the number of households within the
Parish at 2001 and 2011 is provided below based upon information
obtained from the Censuses. Figures are also provided on the scale of
change over that period and how the estimate of household size (i.e.
number of people per household) has also changed over that time.
Number of Dwellingsv An
estimate of the number of dwellings in the Parish at 2001 and 2011 is
provided below based upon information obtained from the Censuses.
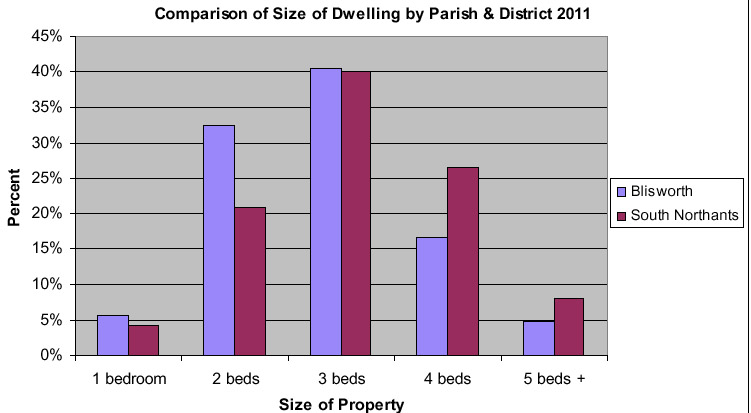
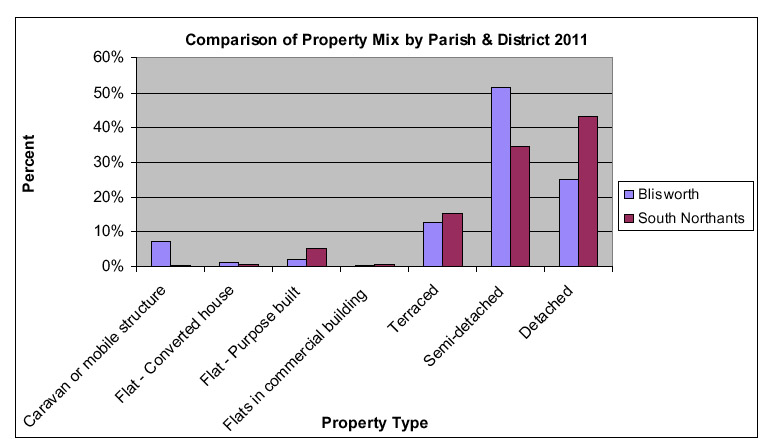
Housing Type and Mix It is important that rural communities have a mixed
housing stock. There is a clear link between the type and size of
dwelling in an area and the mix and age range of population. The most
vibrant villages are likely to have a good mix of dwellings and
therefore a more balanced Number of Bedroomsvi This gives an indication of the number of bedrooms in
each property within the village and the resulting housing mix.
Housing Development – Completions and commitments at 1st April 2013 There may be housing development within the Parish that already has planning permission or that is allocated in the Joint Core Strategy or a Masterplan (this refers to the Roade masterplan) but that is yet to be completed. Appendix 1 sets out the number of commitments within the parish. Appendix 1 also sets out a breakdown of the
number of dwellings that have been completed in the Parish between 2001
and April 2013 (the beginning of the Plan period). This information is
based upon that recorded by the Council and is based upon planning and
building control House prices in Blisworth The
average price of property sold in Blisworth in the past 5 years (data
from Zoopla.co.uk) was £215,674 and there were 92 dwellings sold during that time from
which this figure was obtained. Property values have risen by 2.02%
since August 2012. There are currently (August 2013) 9 properties
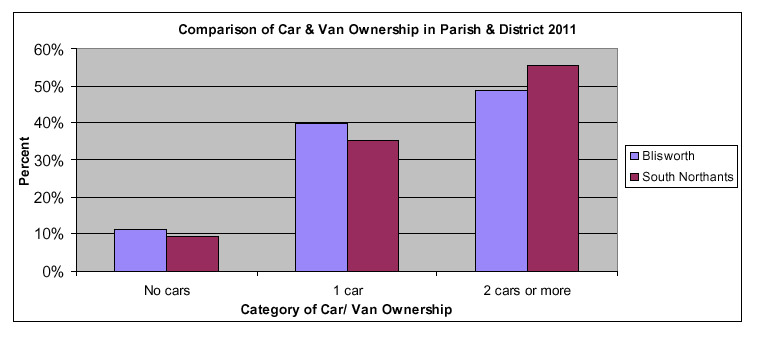
3. Social Indicators a. Accessibility and Car ownership Accessibility and the lack of public transport are recognised as potential issues within rural areas. Typically in many rural areas the number of households with cars within the Parish has increased since 2001. There is generally a higher number of households with cars in rural areas than in the District overall. There has also been an increase in the number of properties with 2 or more vehicles. Number
of Cars per Household
b. Owner-occupancy Typically owner-occupancy is high within
Parishes compared to towns. The proportion of households owning their
own properties in Blisworth (or paying a mortgage for their property).
4. Employment Rural employment is important as the villages
within South Northamptonshire are increasingly becoming dormitory
villages where the majority of people commute out of the village to
work. The Council is seeking to encourage growth and development that
will benefit the District and The data below helps to provide a picture of employment availability within the Parish. Ratio
of jobsvii to number of residentsviii for the Ward
containing Blisworth:
Approx. 4% of the residents within the Parish work from homex, compared to a District wide figure of 6%. Claimant count with rates and proportions (ONS/ Nomis) At any given time there will be a certain
proportion of the working age population who will be out of
work. The Job Seekers Allowance claimant count provides a timely
snapshot of the proportion of the resident working age population
who are currently in receipt of this out of work benefit. However there
may also be others seeking work who are not entitled to claim or choose
not to. Within the Blakesley and Cote Ward there were 57 job seeker
claimants in June 2013. This figure has changed over the past 8 years as
follows:
Appendix 1 How many additional dwellings are needed in Blisworth Parish? Government policy as set out in the National
Planning Policy Framework seeks to increase significantly the supply
of new housing and sets out the requirement for Local Plans to meet
the objectively assessed need for new homes “unless the adverse
impacts of doing so would The JCS will set the total minimum number of dwellings required for the urban and rural areas of South Northamptonshire and will show how the agreed housing targets will be delivered through the Plan period. This overall target is based on a calculation of an ‘objectively assessed housing need’ that takes account of both the latest Office of National Statistics (ONS) household projections and the 2011 Census results. Having derived this housing need the next step was to develop realistic options about how this requirement could be met. For the Joint Core Strategy this included consideration of evidence such as the availability of sites taking account of deliverability, viability and constraints. An important part of the Local Plan will be to distribute the housing growth set out in the JCS across the District. One way of considering how many houses should be provided in a particular village could be to take the overall requirement for housing in the rural areas and proportion this by village in relation to their existing number of dwellings. Effectively this would give the ‘objectively assessed housing need for each settlement area. This proportion could then be increased or decreased by consideration of factors including: •
What
is the existing housing mix within a village? •
What
is the identified affordable housing need? •
what
are the individual aspirations for each village for growth to assist
in the supporting •
what
level of development has previously been achieved? •
what
sites are deliverable - suitable, available now, achievable and
viable? •
what
local environmental designations exist? •
What
is the existing ability of a village to support additional housing in
relation to local •
What
is the role of the settlement? Appendix 1 sets out the numbers this would
involve based on the current Core Strategy figures. The assumption has
been made that the rural part of the District has 23428 dwellings
(data from the 2001 Census) and that the Joint Core Strategy requires
3605 new dwellings in the rural area between 2001 and 2006. This gives
a 15.5% increase in the number of dwellings in the rural area. The
extract from the table below sets out the housing numbers that would
be required in Blisworth before any consideration of the issues set
out above. However it needs to be stressed that this is only a
worked example and the final figure is likely to change as a result of
changes to the figures in the Joint Core Strategy. The Issues Paper
asks for comments on this approach. A copy of the table as it relates
to all the villages within the District can be found in Appendix 1.
The data for completions and commitments is up to 31st March 2013. i Census 2001 & 2011 Age Structure (2001 - KS02; 2011 – KS102EW) ii Census 2001 & 2011 Age Structure (2001 - KS02; 2011 – KS102EW) iii Census 2001 Housing Stock (UV53); Census 2011 Household Spaces (QS417EW) iv Census 2001 Rooms, Amenities, Central Heating & Lowest Floor Level (KS19); Census 2011 Rooms, Bedrooms and Central Heating (KS403EW) v Census 2001 Dwellings (UV55), Census 2011 Dwellings (QS418EW) vi Census 2011 Number of Bedrooms (QS411EW) vii Census 2011 Economic Activity (QS601EW) viii Census 2011 Economic Activity (QS601EW) ix Census 2011 Economic Activity (QS601EW) x Census 2011 Method of Travel to Work (QS701EW) Tables regarding the 'proportional housing' parish expansion are omitted because the idea has been overturned as a useful guide. |
|||||||||||||||||||||||||||||||||||||||||||||||||||||||||||||||||||||||||||||||||||||||||||||||||||||||||||||||||||||||||||||||||||||||||||||||||||||||||||||||||||||||||||||||||||||||||||||||||||||||||||||||||||||||||||||||||||||||||||||||||||||||||||||||||||||||||||||||||||||||||||||||||||||||||||||||||||||||||||||||||||||||||||||||||||||||||||||||||||||||